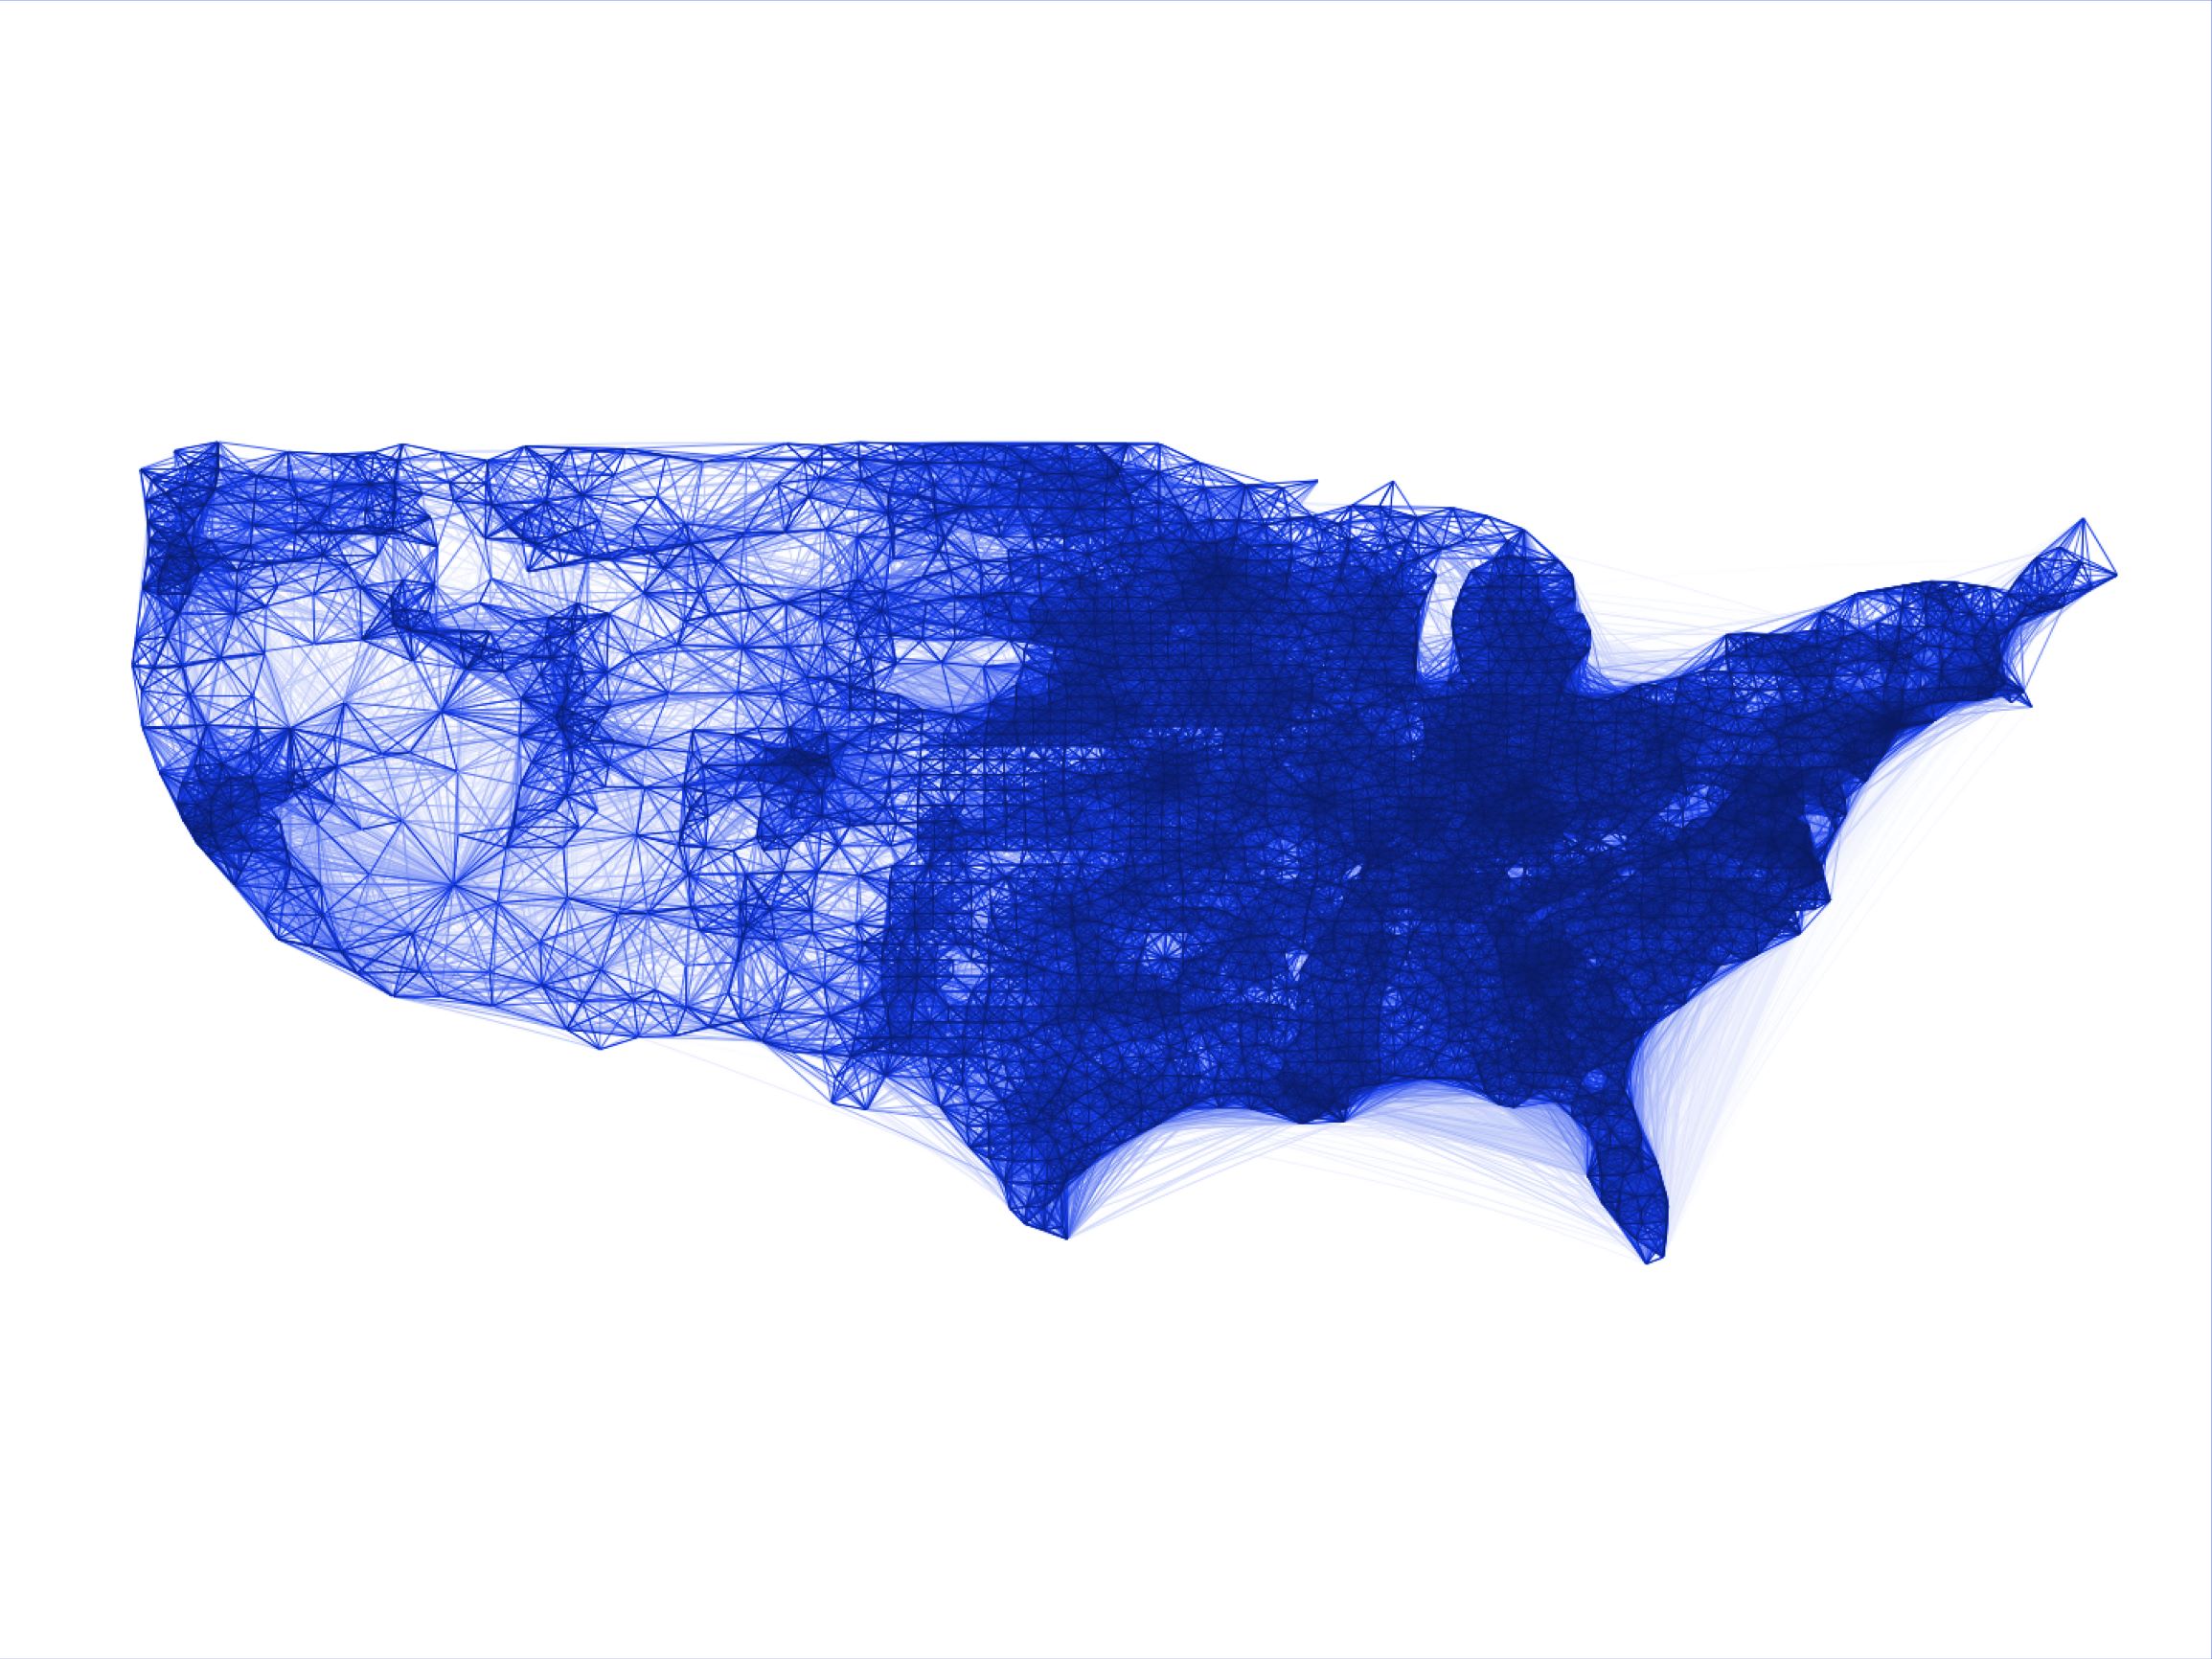
Facebook’s co-location map aggregates users’ location data to map frequent travel patterns. Disease modelers could use it to determine how Covid-19 might spread.
Google and Facebook are launching their own toolsets to help researchers predict and track the spread of Covid-19. Most of the tools use aggregated location data, which is then pulled into various maps and measurements.
While aggregated location data is nothing new — for example, Google has used it to see when restaurants are busy — its use for tracking a pandemic brings up questions about the tradeoff between public health and privacy.


These Are the Top-Rated Autism Therapy Centers in Texas
There are a number of criteria for selecting the best autism therapy centers. Parents choosing a facility or professionals seeking to improve their offerings should consider certain standards to ensure the right fit.
On Monday, Google launched community mobility reports, which pull in location data to see what has changed as residents of different states stay at home. In New York, for example, the report said retail and recreation activity was down 62% and time spent at workplaces was down 46%, while time spent at home was up 16%.
Google pulls the data for this service when users have location services turned on in their phone. The company said it uses aggregated, anonymized data and adds artificial noise to make it impossible to identify any individual person.
Facebook also rolled out a set of tools yesterday. Also using aggregated location data, the company said it is mapping co-location patterns, which visualize frequent routes of travel to predict future outbreaks. It’s also publishing information on movement range trends, to see if people are staying at home, and social connectedness, to see where hard-hit areas have connections and might seek support across the U.S.
In addition to that, the company is prompting users on its website to participate in a voluntary survey from Carnegie Mellon University Delphi Research Center to help researchers identify Covid-19 hotspots earlier.

Redefining Payer Operations: Data-Driven Strategies for the Future of Healthcare
This eBook provides actionable strategies, real-world best practices to help payers stay ahead in a value-based care environment.
Neither company is the first to do this.
Unacast, a New York-based startup that aggregates location data from users’ smartphones for retail and real estate businesses, released its “social distancing scoreboard” last month. The maps showed which regions had been the most successful in staying at home by measuring changes in mobility. For example, the company gave California a “C.” It also breaks the data down county-by-county.
Thought the accuracy of the data has not been confirmed, state and local officials have often referred to it in their exhortations for the public to stay at home. After Louisiana got a “D” grade on the map, Louisiana Governor John Bel Edwards said in a press conference, “For those of you who are not taking the crisis seriously, I’m asking you to do a better job.”
Unacast has not specified which third-party sources it uses to collect user data. According to Recode, its software development kit (SDK) is its preferred data source. Apps, such as step trackers or smart TV remotes, can include more than a dozen SDKs.
In short, that means most people won’t have the option to opt-out from their data being used for these maps. But if they provide researchers with valuable information, is it worth it?